
Quick answer
Average Rate of Change = (f(b) − f(a)) / (b − a).
Formula
- (f(b) − f(a)) / (b − a)
- Δf / Δx on interval [a, b]
Introduction
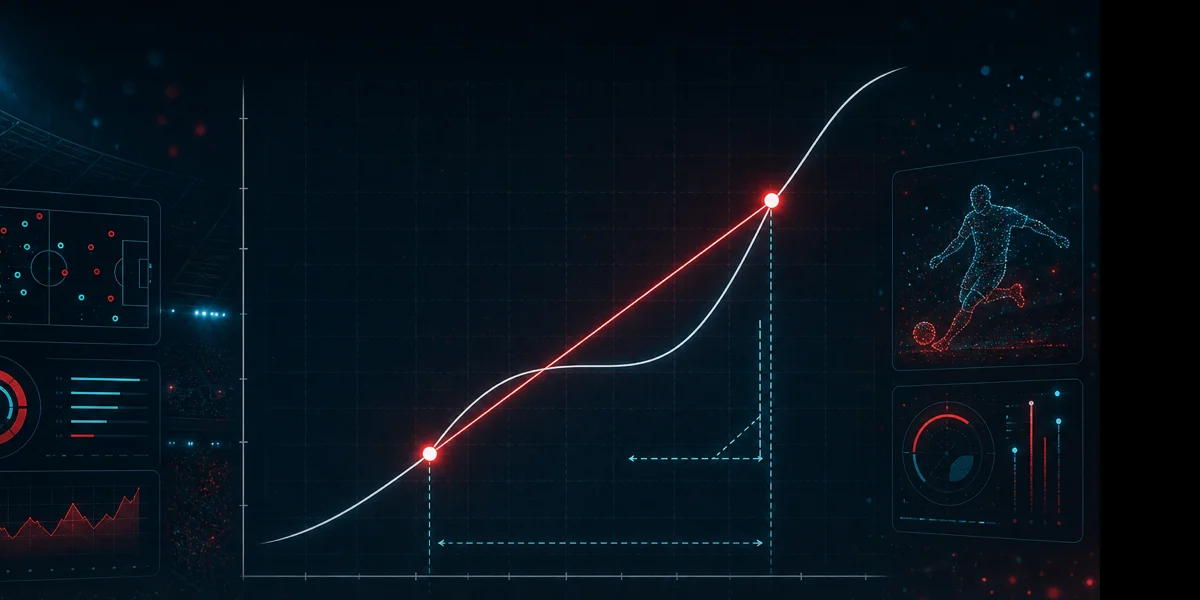
Textbooks introduce this fraction as the slope of a secant line. The Average Rate of Change Calculator applies the same rule using your first and last entered points and draws both your data path and the secant rate line.
If you need intuition before symbols, start with what is average rate of change, then return here for notation you can reuse on every problem.
Function form and table form look different on paper but describe the same operation: endpoint output change divided by endpoint input change. Our examples article walks through linear, quadratic, and application setups.
Always verify b ≠ a. Matching inputs make the denominator zero and the rate undefined.
Function notation and table form
f(a) and f(b) are outputs at inputs a and b. The fraction compares their change to the change in inputs.
For tables labeled x_1 through x_n, many homework problems use (f(x_n) − f(x_1))/(x_n − x_1) when the interval runs from the first row to the last row.
Units travel with the result. If f is dollars and x is years, the rate is dollars per year.
The formula does not use interior rows unless a problem explicitly defines a different interval.
Core formula
- (f(b) − f(a)) / (b − a)
- (f(x_n) − f(x_1)) / (x_n − x_1) for endpoint tables
- Slope form: (y_2 − y_1) / (x_2 − x_1)
Write Δf = f(b) − f(a) and Δx = b − a before dividing. That habit reduces sign errors.
On a coordinate plane, (a, f(a)) and (b, f(b)) define a secant. Its slope equals the formula value.
- Identify a and b. Use the interval stated in the problem, not arbitrary rows.
- Evaluate or read f(a) and f(b). Substitute into the rule or select table cells.
- Form the difference quotient. Place Δf over Δx with consistent order.
- Simplify and label. Reduce fractions when helpful; keep units in the final sentence.
Example with f(x) = 2x + 1
On the interval from 1 to 4: f(1) = 3 and f(4) = 9.
Rate = (9 − 3)/(4 − 1) = 6/3 = 2. The output increases by 2 units per 1-unit increase in x.
Because the function is linear, every equal-length interval on the same line gives the same rate. Curved graphs behave differently; see the examples guide for a quadratic secant.