
Quick answer
Always: subtract outputs, subtract inputs, divide, interpret.
Formula
- (f(b) − f(a)) / (b − a)
Introduction
Mirror these patterns on your own problems, then check with the Average Rate of Change Calculator.
Keep the formula reference open while you work so notation stays consistent across examples.
When a problem mentions slope language, read average rate of change vs slope to translate between (x, y) points and function notation.
Examples here are intentionally varied: linear, curved, motion, business, and population contexts share the same secant workflow even when units change.
Example types you will see
Linear functions produce constant rates on every equal-length interval along the same line.
Quadratic and other curved graphs still use endpoint values only; the secant slope can differ from slopes at interior points.
Distance-time tables express average velocity with position change over time change.
Business and population tables emphasize reporting windows and honest unit labels in final sentences.
Formula used in every example
- (f(b) − f(a)) / (b − a)
Identify which column is input and which is output before subtracting.
State the interval in words in your final answer, not only the number.
- Copy the pattern. Identify endpoints, compute Δf and Δx, divide, interpret with units.
- Linear example. f(x) = −2x + 10 from 0 to 5 gives f(0)=10, f(5)=0, rate = −2.
- Quadratic example. f(x)=x^2 from 1 to 4: (16−1)/(4−1)=5. Secant slope 5 differs from instantaneous slopes inside the curve.
- Motion example. Position 10 m at 2 s and 34 m at 6 s: rate = 24/4 = 6 m/s average velocity.
- Business example. Revenue $50k to $80k over 3 quarters: ($80−$50)/3 ≈ $10k per quarter average growth.
- Population example. Town population 12,000 to 15,600 over 4 years: 3600/4 = 900 people per year average increase.
Why curved graphs still use endpoints
On f(x)=x^2, the graph bends, but the average rate question still specifies two inputs only.
Students sometimes average interior slopes; that is a different question unless the rubric says otherwise.
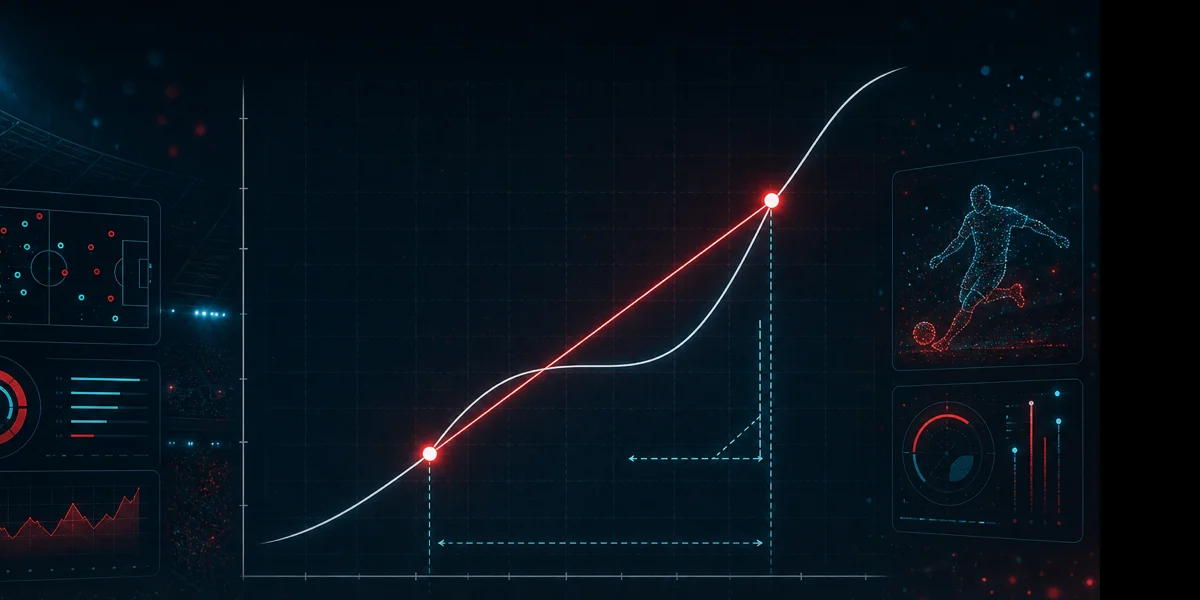
Plot endpoints and draw the secant to see why the single fraction summarizes the interval net change.